Tables for Visual Acuity Conversionfrom any notation to Standard LogMAR notation |
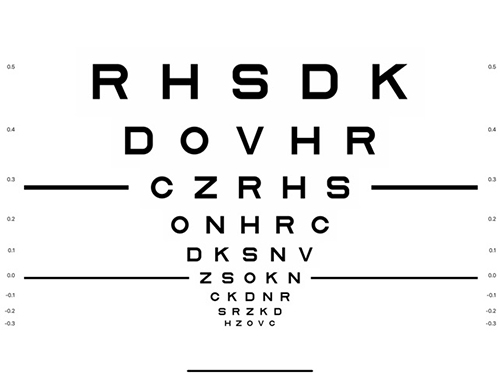
Visual acuity is a critical measure of eye health, used by eye care professionals to assess how sharply an individual can see. The most common notation used is the Snellen chart, named after Hermann Snellen, who developed it in the 1860s. This chart is ubiquitous in testing environments, employing a series of letters of decreasing size to determine clarity of vision or Snellen acuity. However, other scales such as the LogMAR notation, which offers greater precision and range, and the ETDRS chart, designed for research settings to provide standardized vision testing, are the current standards and should be used by doctors in order to allow comparisons from scientific literature. These tools play a crucial role in diagnosing and managing conditions like refractive errors, cataracts, and vision loss, serving as fundamental components of visual acuity measurement.
Visual Acuity Notation Conversion for All Distances
The concept of "visual acuity conversion" involves translating the measured visual acuity across different notations and distances. Since visual acuity can vary significantly based on the distance at which it is tested—from the standardized 20 feet (approximately 6 meters) to near or reading distance—conversion tools are vital. These tools ensure that measurements like distance visual acuity and near vision are consistent and comparable regardless of the initial testing conditions. This is essential not only for clinical assessments but also for applications like fitting glasses or contact lenses, and evaluating the outcomes of procedures like cataract surgery. You should always use Standard LogMAR notation and ETDRS charts that show a geometric variation in visual acuity progression. When an ETDRS chart is not available you should always report your outcomes in logMAR standard notation. If your chart has any of the values in red, we recommend you to change the chart because it does not follow a geometric progression.
|
Line Number |
LogMAR (Standard) |
Visual Angle (min) |
Spatial Frequency (Cyc/deg) |
% Central Visual Efficiency |
Snellen Equivalent (Feet) |
Meter |
Decimal |
|---|---|---|---|---|---|---|---|
| -3 | -0.30 | 0.50 | 60.00 | 100 | 10 | 3.0 | 2.00 |
| -2 | -0.20 | 0.63 | 48.00 | 100 | 12.5 | 3.8 | 1.60 |
| -1 | -0.10 | 0.80 | 37.50 | 100 | 16 | 4.8 | 1.25 |
| 0 | 0.00 | 1.00 | 30.00 | 100 | 20 | 6.0 | 1.00 |
| 1 | 0.10 | 1.25 | 24.00 | 95 | 25 | 7.5 | 0.80 |
| - | 0.18 | 1.50 | 20.00 | 91 | 30 | 9.0 | 0.67 |
| 2 | 0.20 | 1.60 | 18.75 | 90 | 32 | 9.6 | 0.63 |
| 3 | 0.30 | 2.00 | 15.00 | 85 | 40 | 12.0 | 0.50 |
| 4 | 0.40 | 2.50 | 12.00 | 75 | 50 | 15.0 | 0.40 |
| - | 0.48 | 3.00 | 10.00 | 67 | 60 | 18.0 | 0.33 |
| 5 | 0.50 | 3.15 | 9.52 | 65 | 63 | 18.9 | 0.32 |
| - | 0.54 | 3.50 | 8.57 | 63 | 70 | 21.0 | 0.29 |
| 6 | 0.60 | 4.00 | 7.50 | 60 | 80 | 24.0 | 0.25 |
| 7 | 0.70 | 5.00 | 6.00 | 50 | 100 | 30.0 | 0.20 |
| - | 0.76 | 5.70 | 5.26 | 44 | 114 | 34.2 | 0.18 |
| 8 | 0.80 | 6.25 | 4.80 | 40 | 125 | 37.5 | 0.16 |
| - | 0.88 | 7.50 | 4.00 | 32 | 150 | 45.0 | 0.13 |
| 9 | 0.90 | 8.00 | 3.75 | 30 | 160 | 48.0 | 0.13 |
| 10 | 1.00 | 10.00 | 3.00 | 20 | 200 | 60.0 | 0.10 |
| 11 | 1.10 | 12.50 | 2.40 | 17 | 250 | 75.0 | 0.08 |
| - | 1.18 | 15.00 | 2.00 | 16 | 300 | 90.0 | 0.07 |
| 12 | 1.20 | 16.00 | 1.88 | 15 | 320 | 96.0 | 0.06 |
| 13 | 1.30 | 20.00 | 1.50 | 10 | 400 | 120.0 | 0.05 |
| 16 | 1.60 | 40.00 | 0.75 | 5 | 800 | 240.0 | 0.03 |
| 20 | 2.00 | 100.00 | 0.30 | 2 | 2000 | 600.0 | 0.01 |
| 30 | 3.00 | 1000.00 | 0.03 | 0 | 20000 | 6000.0 | 0.001 |
Specific Near Notation Conversion
Near visual acuity testing, which is particularly important for activities like reading or detailed work, uses specific charts like the Near Vision Chart. This test is crucial for detecting vision problems that might not be apparent in distance visual acuity tests. For example, someone might have normal vision when tested with a Snellen eye chart at a distance but could struggle with tasks performed at close range due to issues like presbyopia or hyperopia. Accurate near notation helps tailor interventions, such as reading glasses or specific contact lens prescriptions, to individual needs, enhancing daily functioning and quality of life. Standard notation and charts at near are also logMAR and ETDRS charts. You should avoid reading charts or Jaeger charts for measuring visual acuity at near.
|
Line Number |
LogMAR (Standard) |
% Central Visual Efficiency |
Inches (1/4) |
Centimeters (35/) |
Jaeger Standard |
American Point-Type |
“M” Notation |
|---|---|---|---|---|---|---|---|
| -3 | -0.30 | 100 | 7 | 17.5 | — | 2 | 0.20 |
| -2 | -0.20 | 100 | 8.8 | 21.9 | — | — | 0.25 |
| -1 | -0.10 | 100 | 11.2 | 28.0 | — | — | 0.32 |
| 0 | 0.00 | 100 | 14.0 | 35.0 | 1 | 3 | 0.40 |
| 1 | 0.10 | 100 | 17.5 | 43.8 | 2 | 4 | 0.50 |
| - | 0.18 | 95 | 21 | 52.5 | 3 | 5 | 0.60 |
| 2 | 0.20 | 94 | 22.4 | 56 | 4 | 6 | 0.64 |
| 3 | 0.30 | 90 | 28.0 | 70.0 | 5 | 7 | 0.80 |
| 4 | 0.40 | 50 | 35.0 | 87.5 | 6 | 8 | 1.0 |
| - | 0.48 | 42 | 42.0 | 105.0 | 7 | 9 | 1.2 |
| 5 | 0.50 | 40 | 44.1 | 110.3 | 8 | 10 | 1.3 |
| - | 0.54 | 32 | 49.0 | 122.5 | — | — | 1.4 |
| 6 | 0.60 | 20 | 56.0 | 140.0 | 9 | 11 | 1.6 |
| 7 | 0.70 | 15 | 70.0 | 175.0 | 10 | 12 | 2.0 |
| - | 0.76 | 12 | 79.8 | 199.5 | 11 | 13 | 2.3 |
| 8 | 0.80 | 10 | 87.5 | 218.8 | 12 | 14 | 2.5 |
| - | 0.88 | 6 | 105.0 | 262.5 | — | — | 3.0 |
| 9 | 0.90 | 5 | 112.0 | 280.0 | 13 | 21 | 3.2 |
| 10 | 1.00 | 2 | 140.0 | 350.0 | 14 | 23 | 4.0 |
| 11 | 1.10 | 0 | 175.0 | 437.5 | — | — | 5.0 |
| - | 1.18 | 0 | 210.0 | 525.0 | — | — | 6.0 |
| 12 | 1.20 | 0 | 224.0 | 560.0 | — | — | 6.4 |
| 13 | 1.30 | 0 | 280.0 | 700.0 | — | — | 8.0 |
| 16 | 1.60 | 0 | 560.0 | 1400.0 | — | — | 16.0 |
| 20 | 2.00 | 0 | 1400.0 | 3500.0 | — | — | 40.0 |
| 30 | 3.00 | 0 | 14000.0 | 35000.0 | — | — | 400.0 |
The Importance of Using Standardized Charts and Notation
Standardization in visual acuity testing is paramount. Using standardized charts and notations, like the ETDRS chart and the LogMAR visual acuity notation, ensures that eye doctors can accurately track changes in vision, compare results universally, and make informed decisions about treatments. This level of standardization supports the plausibility checks required in clinical trials and research, contributing to the broader field of vision science. Moreover, for individuals with low vision, these standardized measurements determine the necessary support and devices needed to improve their visual functioning, emphasizing the critical role of consistent and reliable testing in enhancing patient care.


