Advanced Analysis of the Defocus CurveCorrection of Shifted Defocus Curves |
|
|
|
Optimal Manifest Refraction considering the object at infinite and the correction of the vergence distance at which the test is presented for conducting the defocus curve are two very important factors to obtain reliable results.1 For example, if we measure the refraction at 4 m, we have to add -0.25 D to obtain the manifest refraction at infinity and if we conduct later the defocus curve at 2 m we have to add +0.50 D to the manifest refraction to obtain the corrected distance defocus curve. Users that do not follow this procedure can obtain a considerable number of shifted defocus curves generally around ± 0.50 D. Furthermore, despite following this procedure, a shift can also appear in some cases. Averaging shifted defocus curves can result in an underestimation of best visual performance locations and an overestimation at worse locations.
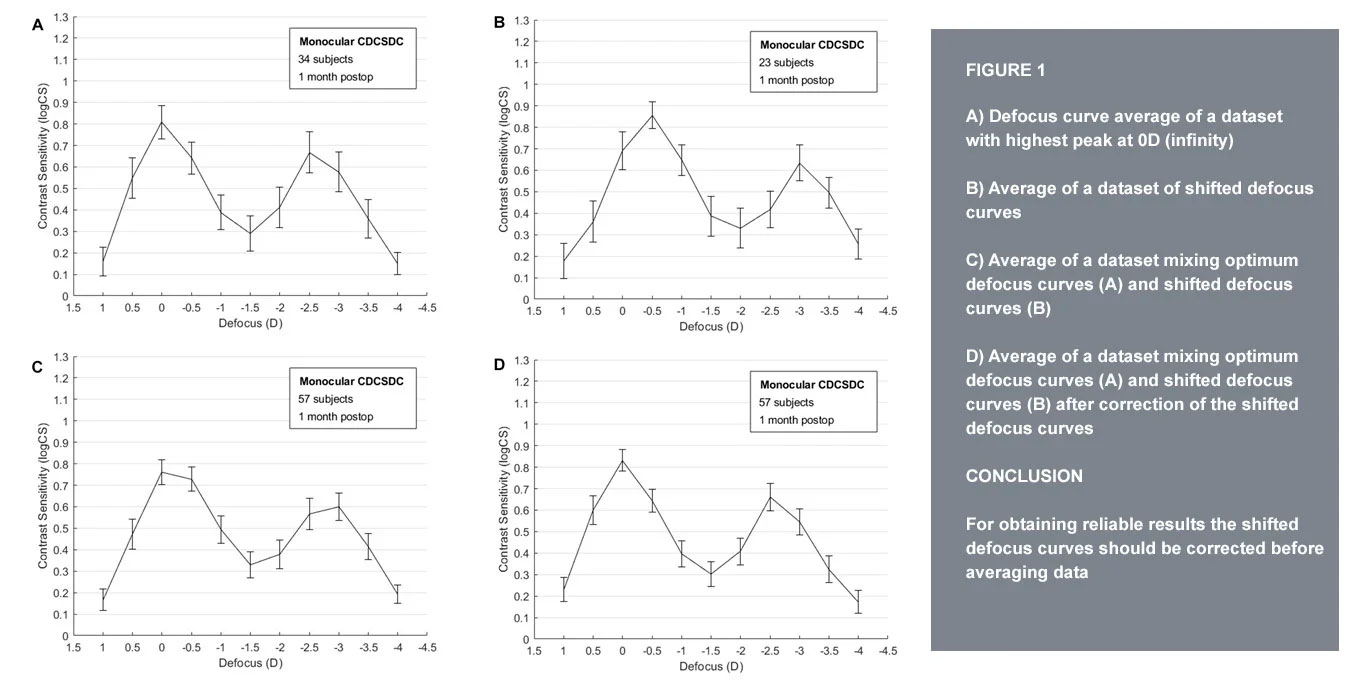
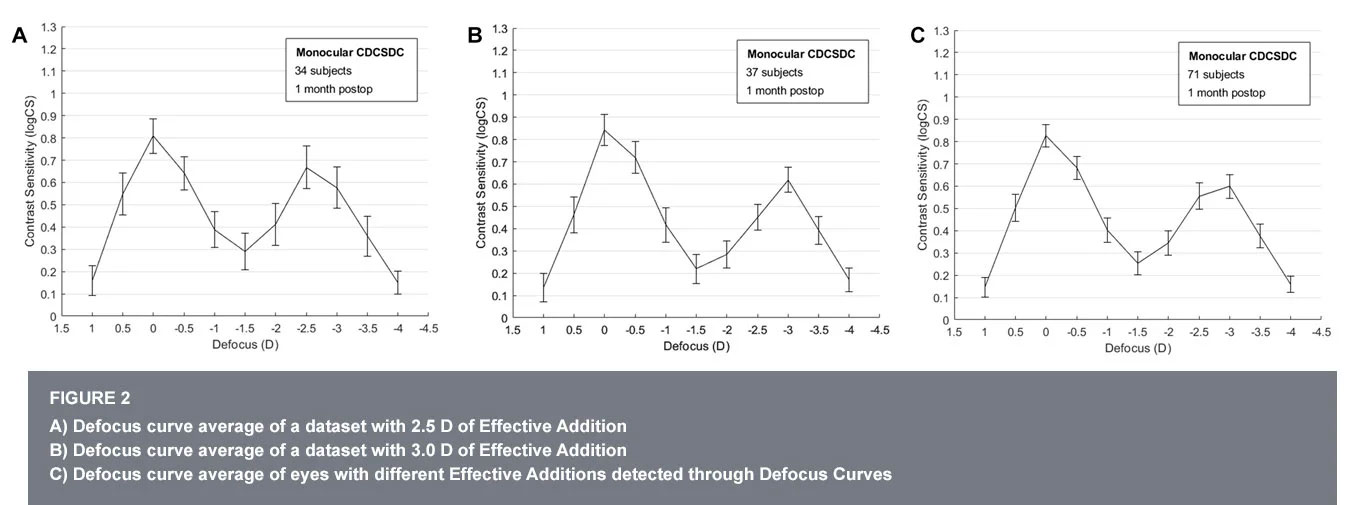
Figure 1A shows the average of a set of measurements for which the highest peak was obtained at the 0 D location, whereas Figure 1B shows the average of defocus curves shifted. Figure 1C shows the result when optimum defocus curves and shifted defocus curves are averaged obtaining a smoother defocus curve. This kind of smooth defocus curve can be seen in studies on which the defocus curve was obtained without manifest refraction and offers an unreliable result that can be wrongly interpreted as a mean Extended Depth of Focus behavior of the Multifocal Intraocular Lens.2 This is the reason why defocus curves should be always obtained with manifest refraction and correcting vergence produced by the presentation distance of the test. To avoid averaging shifted defocus curves we developed an algorithm for the Refractive Analysis Toolbox (v.1.0.3) that: (1) moves the highest peak to the 0 D location or in other words correct the peak before averaging and (2) interpolates the missing data because after correcting the defocus shift some missing data can appear at the extremes of defocus curve. Figure 1D shows that after applying this correction we can average all the data obtaining a similar defocus curve that the obtained in the cases of optimum measured defocus curves (Figure 1A). Addition variationEffective addition (EA) of a Multifocal Intraocular Lens can vary depending on its dioptric power, the corneal power (Km), and the effective lens position (ELP).3 This means that the same MIOL implanted in eyes with higher ELP or higher Km can result in lower Adds than in eyes with lower ELP or lower Km.4 This can be shown in the defocus curve measured with the MLA with peaks at different defocus locations.5 Figure 2 shows a set of averaged measurements with different Adds of 2.5 D (Fig 2A) and 3.0 D (Fig 2B) for the same MIOL. After averaging DC with different additions we can see that misinterpretation of the near vision maximum peak locations can be obtained.
ConclusionData processing of defocus curves can be improved by means of correcting shifted defocus curves and stratifying the datasets depending on the effective addition obtained with the Multifocal Lens Analyzer. For conducting this advanced analysis we added two functions to the Refractive Analysis Toolbox (v1.0.3):
References:
|


